

Behavioral Nudges to Promote Waste Sorting Behavior
Low levels of awareness and waste-sorting behavior at the household level
Summary
We tested the effectiveness of posters and social norms in promoting waste sorting behavior in Gianyar, Bali.
Why we rated it this way
While posters showed limited effectiveness, the social norm had a small positive impact, encouraging households to improve their waste sorting as compared to the control group.
The problem
What we found
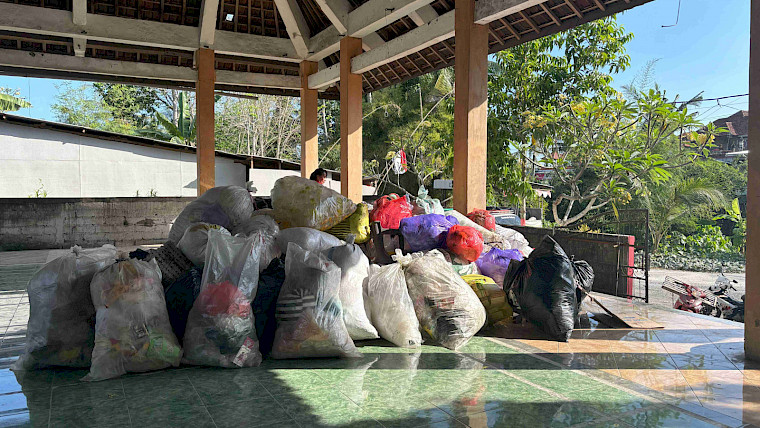
Indonesia is facing a severe waste crisis, generating 64 million tonnes of plastic waste annually, with 3.2 million tonnes ending up in the ocean. Overcrowded landfills are becoming an increasing concern, with 35 landfill fires reported in 2023, largely due to the mismanagement of unsorted waste. Suwung, Bali's largest landfill, receives approximately 800 to 1,500 tonnes of waste daily. To reduce the burden on landfills, it is essential for households to properly sort waste at home.
However, waste sorting at home presents its own set of challenges. Director of Waste Management at the Ministry of Environment, Mr. Novrizal Tahar, emphasized the need to first raise collective awareness about household waste sorting to mitigate environmental risks.1 Encouraging citizen participation in waste sorting is crucial for environmental protection.
Previously, we conducted an experiment using an incentive and sanction system to promote waste sorting behavior. The system awarded points to households that sorted their waste correctly. At the end of the experiment, these points could be exchanged for essential goods as an incentive—the more points a household accumulated, the greater the rewards they received. However, the system showed only a weak effect on improving waste sorting behavior. Given these moderate results, we are now exploring alternative approaches to encourage waste sorting.
The solution
What we tested
In our previous waste sorting experiment, participants who had instructional posters near their waste bins performed better than those who did not. The visual guidance may have positively influenced both the household and the surrounding community by serving as a constant reminder of proper sorting practices.
Another possible driver of behavior change are social norms, which encourage conformity and shape perceptions of acceptable behavior. Norm compliance can persist in both offline and online interactions (Bicchieri et al., 2022). In this experiment, we incorporated social norms through comparing participants’ waste sorting performance against the average community results. In this initiative, we worked with Griya Luhu, a community focused organization dedicated to sustainable waste management in Gianyar Regency, Bali.
Project design
How we ran it
This experiment design was divided into two main sections:
1. Waste Sorting Performance Assessment
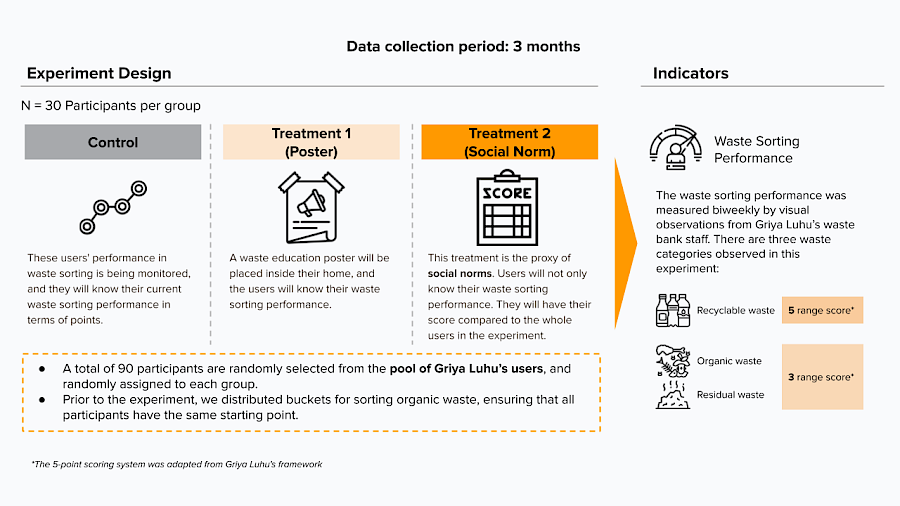
To evaluate waste sorting performance, we randomly selected 90 participants from Griya Luhu’s user pool. These participants were then randomly divided into three groups, with each group receiving a different intervention:
Control Group: Participants received messages about their waste sorting performance score.
Treatment 1 (Waste Education Poster): Participants were provided with waste education posters inside their homes and received messages about their waste sorting performance score.
Treatment 2 (Social Norm): Participants received messages about their waste sorting performance score, along with a comparison to the average community score (a peer comparison).
The data collection period spanned three months between October to December, 2024, with waste sorting assessments conducted every two weeks. Waste was categorized into three types: recyclable, organic, and residual.
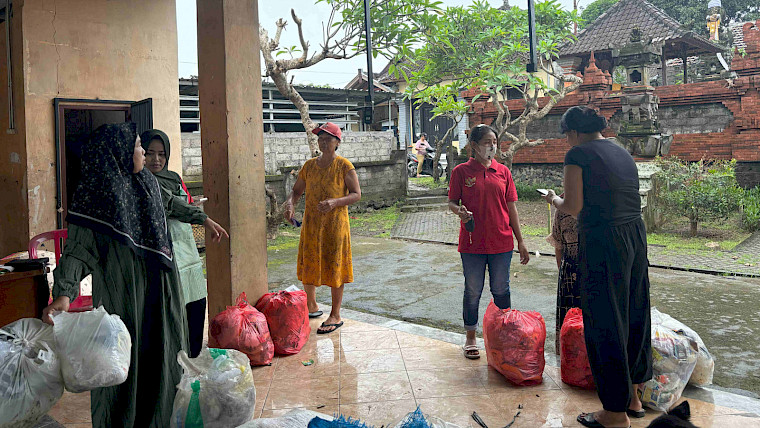
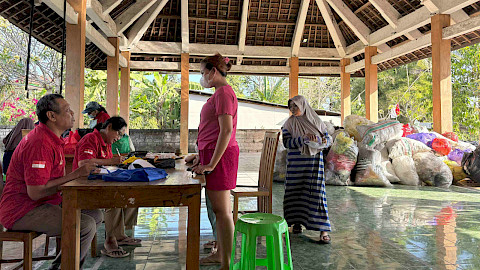
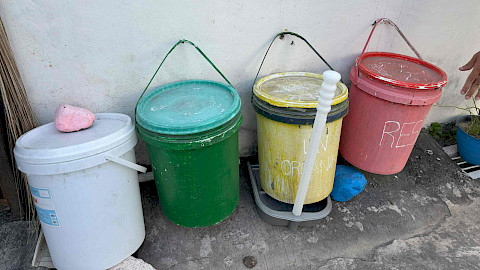
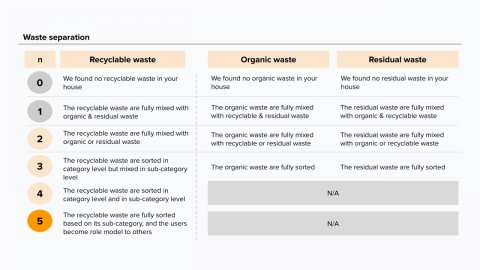
Prior to the experiment, we distributed a bucket and a plastic bag to all participants to ensure they started with the same waste sorting tools. Waste sorting performance was assessed through direct door-to-door inspections conducted by 2–3 Griya Luhu staff members. Performance evaluation was based on a scoring framework, details of which can be found in the Photos and Videos section. The same framework was also used to develop prompts for the performance messages.
Scoring details:
Recyclable Waste: Scored from 0 to 5 points, following Griya Luhu’s existing system.
Organic and Residual Waste: Scored from 0 to 3 points, based on criteria developed by Kopernik, tailored to the local context.
2. Performance communication
Once the data was collected and the scores calculated, we generated personalized messages for participants based on their assessment results (examples are available in the Photos and Videos section).
Messages were distributed simultaneously via WhatsApp according to the participants’ assigned groups. Each participant received a message biweekly, resulting in a total of six messages during the experiment.
The technology

Results
What we learned
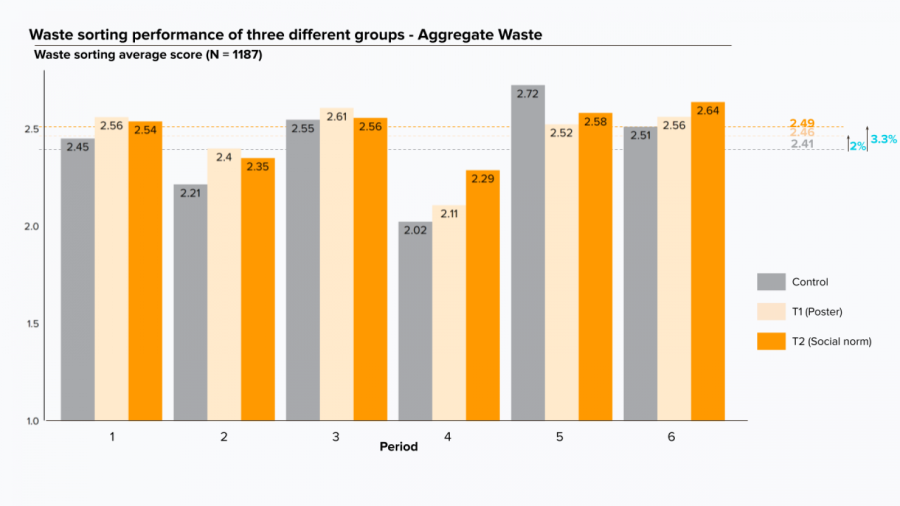
There was a small but notable difference in waste-sorting behavior among the three groups. The social comparison group (treatment 2) achieved the highest score, 3.3% above the control group, followed by the poster group (treatment 1) at 2% above the control group. Although the differences were relatively small, they are statistically significant at the 10% level. Across the six measurement periods, the social-comparison and poster interventions consistently outperformed the control group—except in Period 5, when the control group unexpectedly posted the top score.
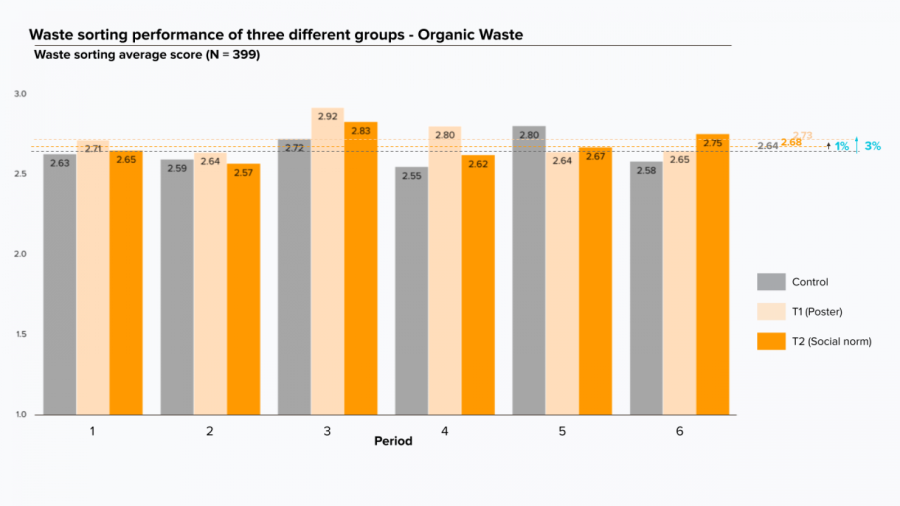
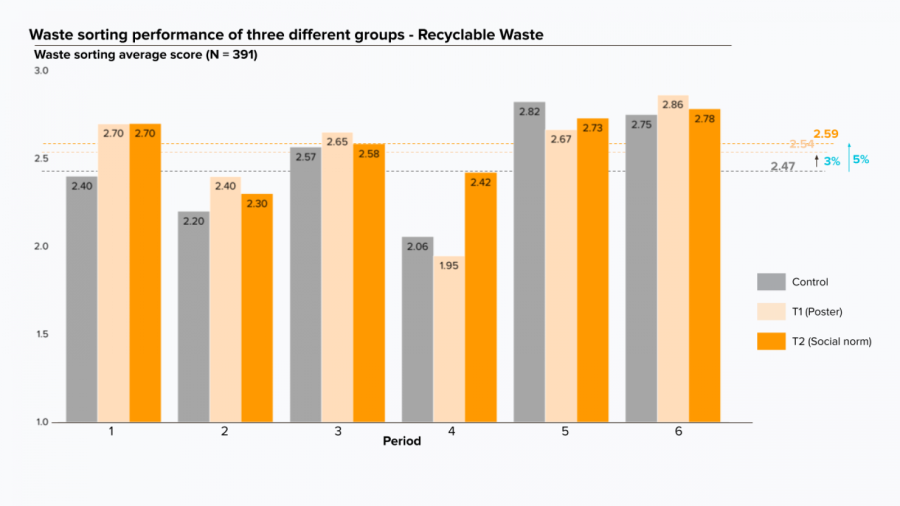
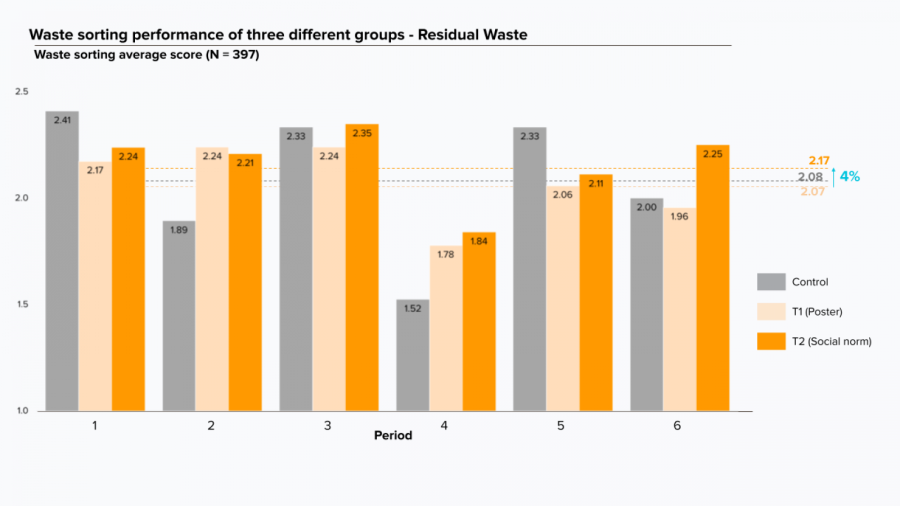
We also analyzed waste-sorting behavior across the three waste types. For organic waste, both the poster and social comparison groups performed slightly better than the control group, with margins of 3% and 1% respectively. The overall scores for organic waste were relatively high, suggesting strong awareness of sorting this type of waste among participants. Recyclable waste showed a similar pattern, with the social comparison and poster groups outperforming the control group by 5% and 3%, respectively. However, for residual waste, the results differed slightly—both the social comparison and control groups scored higher than the poster group. On average, residual waste sorting had the lowest scores among the three types, indicating it was the most challenging type of waste to sort. These differences, however, were not statistically significant.
Conclusion
Social comparison successfully encouraged households to improve their waste-sorting behavior relative to the control group. The effect on the overall waste-sorting score, however, was modest despite being statistically significant. When examined by waste type, there were no significant differences in sorting performance among the groups. For the next step, we will encourage local stakeholders to scale up and replicate this initiative, as the marginal cost of implementing the social comparison treatment is relatively low.